Five Powerful Modules
Each module works independently or together to provide complete market context. From timing to execution, every aspect of smart money trading is covered.
Session Manager
Time-based market segmentation for optimal trade timing
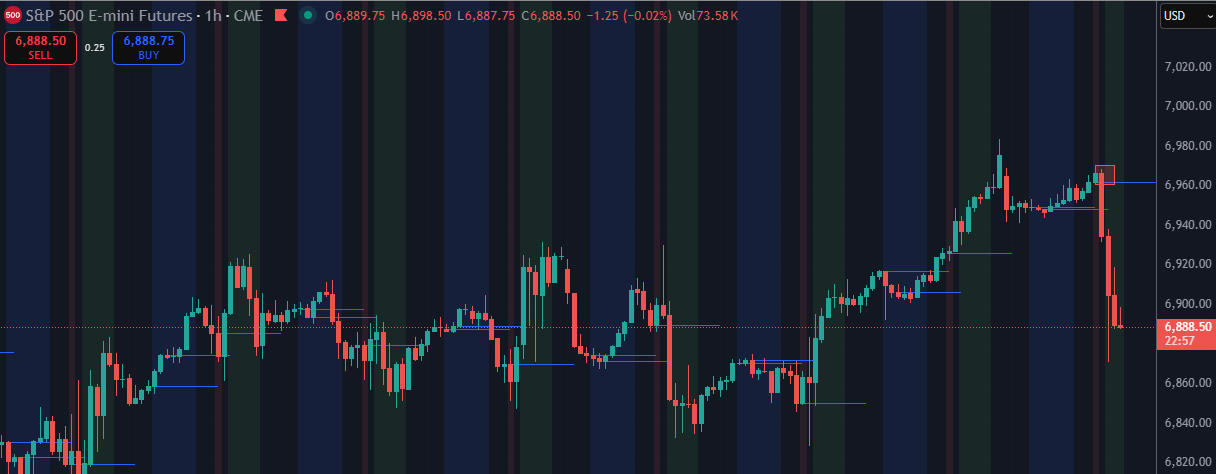
Session Manager displaying Asia, London, and New York sessions with open price levels
The Session Manager allows traders to define and visualize specific trading hours directly on the chart. Different market sessions exhibit distinct volatility and liquidity characteristics — trading the right session dramatically improves win rates.
| Visual Element | Description |
|---|---|
| Vertical Bands | Colored background zones showing active trading sessions |
| Blue Horizontal Lines | Session Open prices — critical reference levels |
| Red/Green Vertical Lines | Session boundaries and key time markers |
- Timezone Selection: Auto-adjust to your broker's timezone
- Custom Session Windows: Define exact start/end times for each session
- Open Lines: Mark critical opening price levels (Asia Open, London Open, NY Open)
- Visual Distinction: Each session rendered in distinct colors for instant recognition
Why Sessions Matter
Institutional money flows during specific hours. The London-NY overlap (8:00-11:00 AM EST) typically produces 70% of daily volume. Trading outside high-probability windows often results in choppy, unpredictable price action.
Fair Value Gaps (FVG)
Identifying institutional imbalance zones
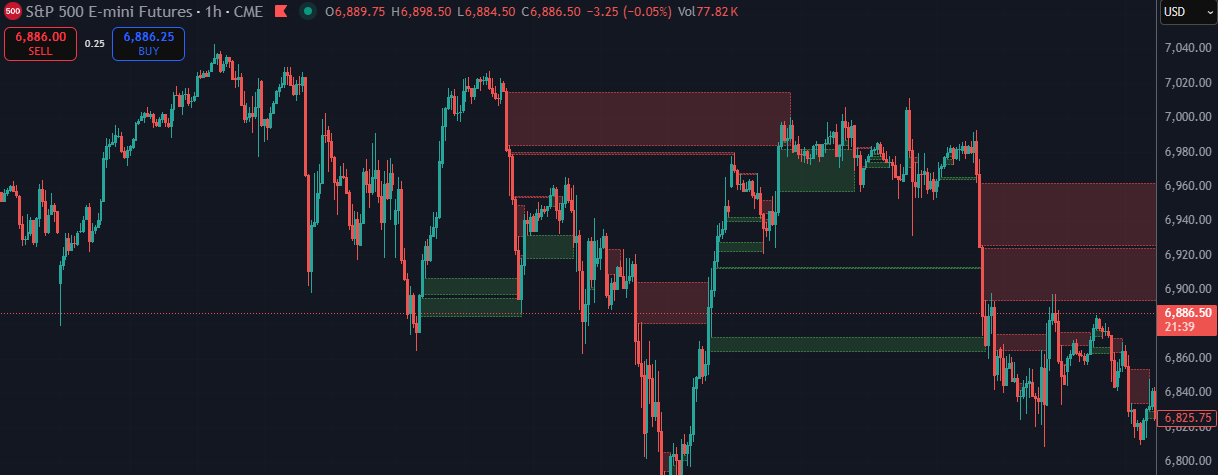
FVG module displaying bullish (green) and bearish (red) imbalance zones
Fair Value Gaps represent price areas where aggressive institutional buying or selling created an "imbalance" — a vacuum in the order book that price eventually returns to fill. These zones act as magnets for future price action.
| Element | Description |
|---|---|
| Green Boxes | Bull FVGs — support zones below price where aggressive buying occurred |
| Red Boxes | Bear FVGs — resistance zones above price where aggressive selling occurred |
| Box Borders | Solid = untested/active; Faded/Dashed = tested or mitigated |
How FVGs Form
When a candle's wick completely gaps above/below the previous candle's wick without overlapping, it signals that one side (bulls or bears) dominated so completely that no opposing orders filled the gap. This inefficiency gets "remembered" by the market.
Trading Application
- Entry Targets: Price often retraces to fill FVGs before continuing — optimal entry zones
- Stop Loss Placement: Beyond the FVG extreme provides logical, technically-sound risk management
- Confluence: FVGs overlapping with Order Blocks create high-probability reversal zones
Market Gaps
Capturing overnight and weekend discontinuities
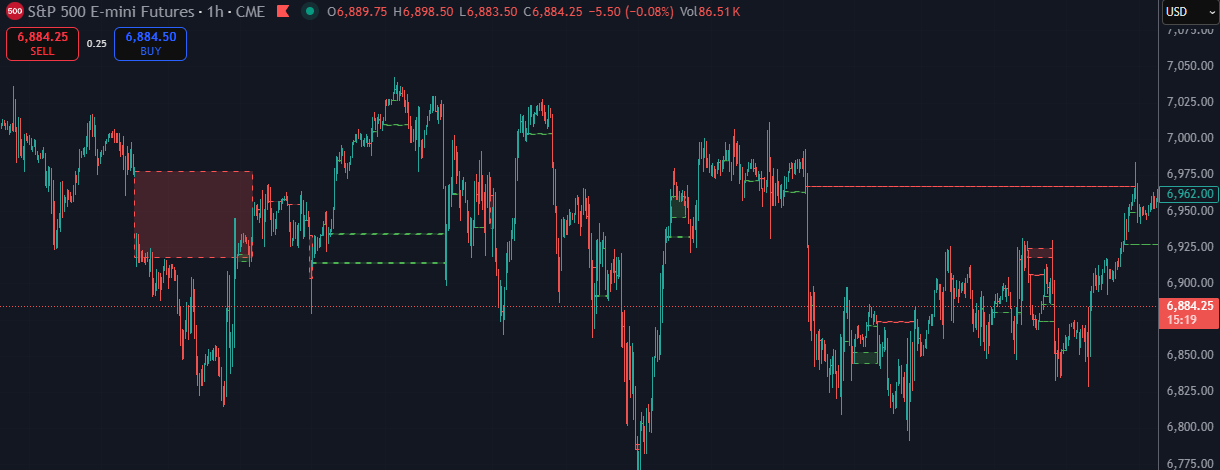
Gap levels marked with dashed lines showing support/resistance from price discontinuities
Market Gaps occur when price opens significantly higher or lower than the previous close, creating a visible "gap" on the chart. These represent extreme sentiment shifts and often act as critical support/resistance levels.
| Element | Description |
|---|---|
| Green Dashed Lines | Bull Gap levels — support created by upside gaps |
| Red/Zones | Bear Gap areas — resistance from downside gaps |
| Horizontal Extensions | Gap levels project forward until filled or invalidated |
Gap Types
- Bull Gap: Price gaps up — indicates strong buying pressure, acts as support
- Bear Gap: Price gaps down — indicates strong selling pressure, acts as resistance
Trading Gaps
Gaps create "unfilled orders" — traders who missed the move wait to enter if price returns to the gap. Gap Fill Strategy: Trade the return to gap with expectation of bounce. Gap Continuation: If price only partially fills then reverses, indicates strong trend continuation.
Order Blocks (OB & MOB)
Institutional footprint visualization
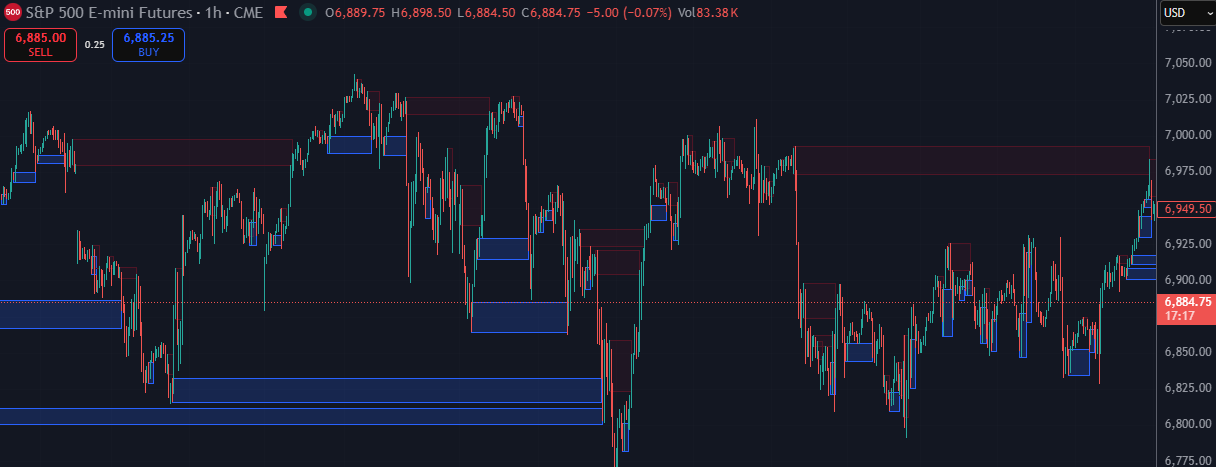
Order Blocks: Dark green/red = active OBs | Blue/Purple = mitigated MOBs
Order Blocks represent the last opposing candle before a strong directional move — essentially where institutional traders accumulated positions before the breakout. These zones become critical support/resistance on retests.
| Type | Color | Description |
|---|---|---|
| OB Bull | Dark Green | Last bearish candle before strong bullish move — fresh support |
| OB Bear | Dark Red | Last bullish candle before strong bearish move — fresh resistance |
| MOB Bull | Blue | Mitigated Order Block — price already tested this zone |
| MOB Bear | Purple/Dark | Mitigated Order Block — price already tested this zone |
Trading Application
- Entry Zones: Price returning to untested OB = highest probability entry
- Invalidation: Full mitigation (close beyond OB) = setup invalidated
- Confluence: OB + FVG overlap = "Golden Zone" with exceptional win rates
- Trend Bias: Series of higher bull OBs = bullish structure intact
ZigZag Structure Analysis
Automatic swing detection for market structure
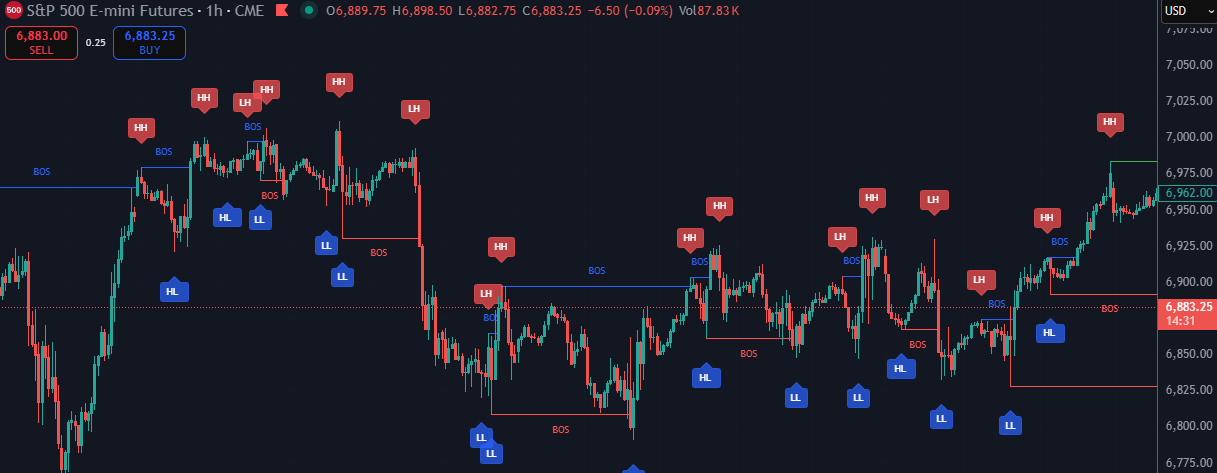
Market Structure: HH (Higher High), HL (Higher Low), LH (Lower High), LL (Lower Low) with BOS breaks
The ZigZag module automatically identifies swing highs and lows, then classifies market structure breaks — essential for determining trend direction, momentum shifts, and trade entry timing.
| Label | Box Color | Meaning |
|---|---|---|
| HH | Red | Higher High — bullish continuation |
| HL | Blue | Higher Low — bullish structure intact |
| LH | Red | Lower High — bearish structure |
| LL | Blue | Lower Low — bearish continuation |
| BOS Line | Blue/Red | Break of Structure level — key reference |
Core Concepts
ChoCH (Change of Character)
A shift in market behavior indicating potential trend reversal. Bullish ChoCH: Price breaks above previous lower high in downtrend. Bearish ChoCH: Price breaks below previous higher low in uptrend. Signals that selling/buying pressure is exhausting.
BOS (Break of Structure)
Confirmation that trend is continuing. Bullish BOS: Price breaks above previous higher high in uptrend. Bearish BOS: Price breaks below previous lower low in downtrend. Signals trend continuation and validates pullback entries.
Structure Trading
Bullish Sequence: Higher Low (HL) → BOS (break HH) → Pullback to OB/FVG → Entry
Reversal Warning: Higher Low fails → ChoCH forms → Wait for BOS confirmation → New trend entry